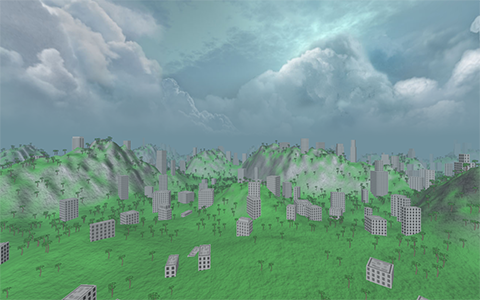
Gistualizer: An Immersive Glyph for Multidimensional Datapoints

Data from diverse workflows is often too complex for an adequate analysis without visualization. One kind of data are multi-dimensional datasets, which can be visualized via a wide array of techniques. For instance, glyphs can be used to visualize individual datapoints. However, glyphs need to be actively looked at to be comprehended. This work explores a novel approach towards visualizing a single datapoint, with the intention of increasing the user’s awareness of it while they are looking at something else. The basic concept is to represent this point by a scene that surrounds the user in an immersive virtual environment. This idea is based on the observation that humans can extract low-detailed information, the so-called gist, from a scene nearly instantly (equal or less 100ms). We aim at providing a first step towards answering the question whether enough information can be encoded in the gist of a scene to represent a point in multi-dimensional space and if this information is helpful to the user’s understanding of this space.
@inproceedings{Bellgardt2017,
author = {Bellgardt, Martin and Gebhardt, Sascha and Hentschel, Bernd and Kuhlen, Torsten W.},
booktitle = {Workshop on Immersive Analytics},
title = {{Gistualizer: An Immersive Glyph for Multidimensional Datapoints}},
year = {2017}
}

